What €200,000 buys you in 29 European markets
One budget, twenty-nine markets, one method. €200,000 buys 18.9 m² of a median flat in Paris and 154 m² in Tbilisi — an eightfold spread inside a single continent, and most of it between capitals rather than between capitals and villages.
Most people decide what they want to buy in Europe before they check what the same money buys in different places. That ordering is understandable and expensive. The gap between the top and bottom of this table is not a rounding difference or a quality difference — it is the difference between a studio and a family home for identical money.
So we measured it, holding the method completely constant: the median asking price per square metre, the same twelve-month window, a single currency-conversion date, and a floor of 2,000 listings per city. Then we divided €200,000 by it.
The table
| City | €/m² | m² for €200k | Listings | Sources | |
|---|---|---|---|---|---|
| Paris | FR | €10,576 | 18.9 m² | 70,801 | 1 |
| Amsterdam | NL | €8,220 | 24.3 m² | 7,201 | 1 |
| Lisbon | PT | €6,880 | 29.1 m² | 22,684 | 1 |
| Stockholm | SE | €6,844 | 29.2 m² | 13,715 | 1 |
| Prague | CZ | €6,376 | 31.4 m² | 27,110 | 1 |
| Nice | FR | €6,015 | 33.3 m² | 20,826 | 3 |
| Vienna | AT | €5,992 | 33.4 m² | 8,866 | 1 |
| Madrid | ES | €5,827 | 34.3 m² | 31,444 | 3 |
| Milan | IT | €5,096 | 39.2 m² | 115,267 | 1 |
| Barcelona | ES | €5,000 | 40 m² | 23,396 | 3 |
| Berlin | DE | €4,963 | 40.3 m² | 29,111 | 2 |
| Porto | PT | €4,800 | 41.7 m² | 26,204 | 1 |
| Lyon | FR | €4,788 | 41.8 m² | 20,572 | 1 |
| Florence | IT | €4,448 | 45 m² | 28,829 | 1 |
| Marseille | FR | €3,998 | 50 m² | 26,305 | 2 |
| Budapest | HU | €3,932 | 50.9 m² | 10,703 | 3 |
| Warsaw | PL | €3,851 | 51.9 m² | 65,619 | 3 |
| Málaga | ES | €3,803 | 52.6 m² | 12,126 | 3 |
| Tallinn | EE | €3,639 | 55 m² | 9,319 | 1 |
| Kraków | PL | €3,501 | 57.1 m² | 33,666 | 3 |
| Valencia | ES | €3,239 | 61.7 m² | 12,226 | 3 |
| Rome | IT | €2,778 | 72 m² | 157,248 | 2 |
| Sevilla | ES | €2,604 | 76.8 m² | 7,353 | 3 |
| Naples | IT | €2,125 | 94.1 m² | 30,663 | 1 |
| Bucharest | RO | €1,935 | 103.3 m² | 100,652 | 1 |
| Turin | IT | €1,667 | 120 m² | 40,527 | 1 |
| Kyiv | UA | €1,575 | 127 m² | 190,904 | 1 |
| Riga | LV | €1,400 | 142.9 m² | 26,287 | 2 |
| Batumi | GE | €1,394 | 143.5 m² | 59,809 | 1 |
| Lviv | UA | €1,362 | 146.9 m² | 46,229 | 1 |
| Tbilisi | GE | €1,299 | 154 m² | 870,090 | 1 |
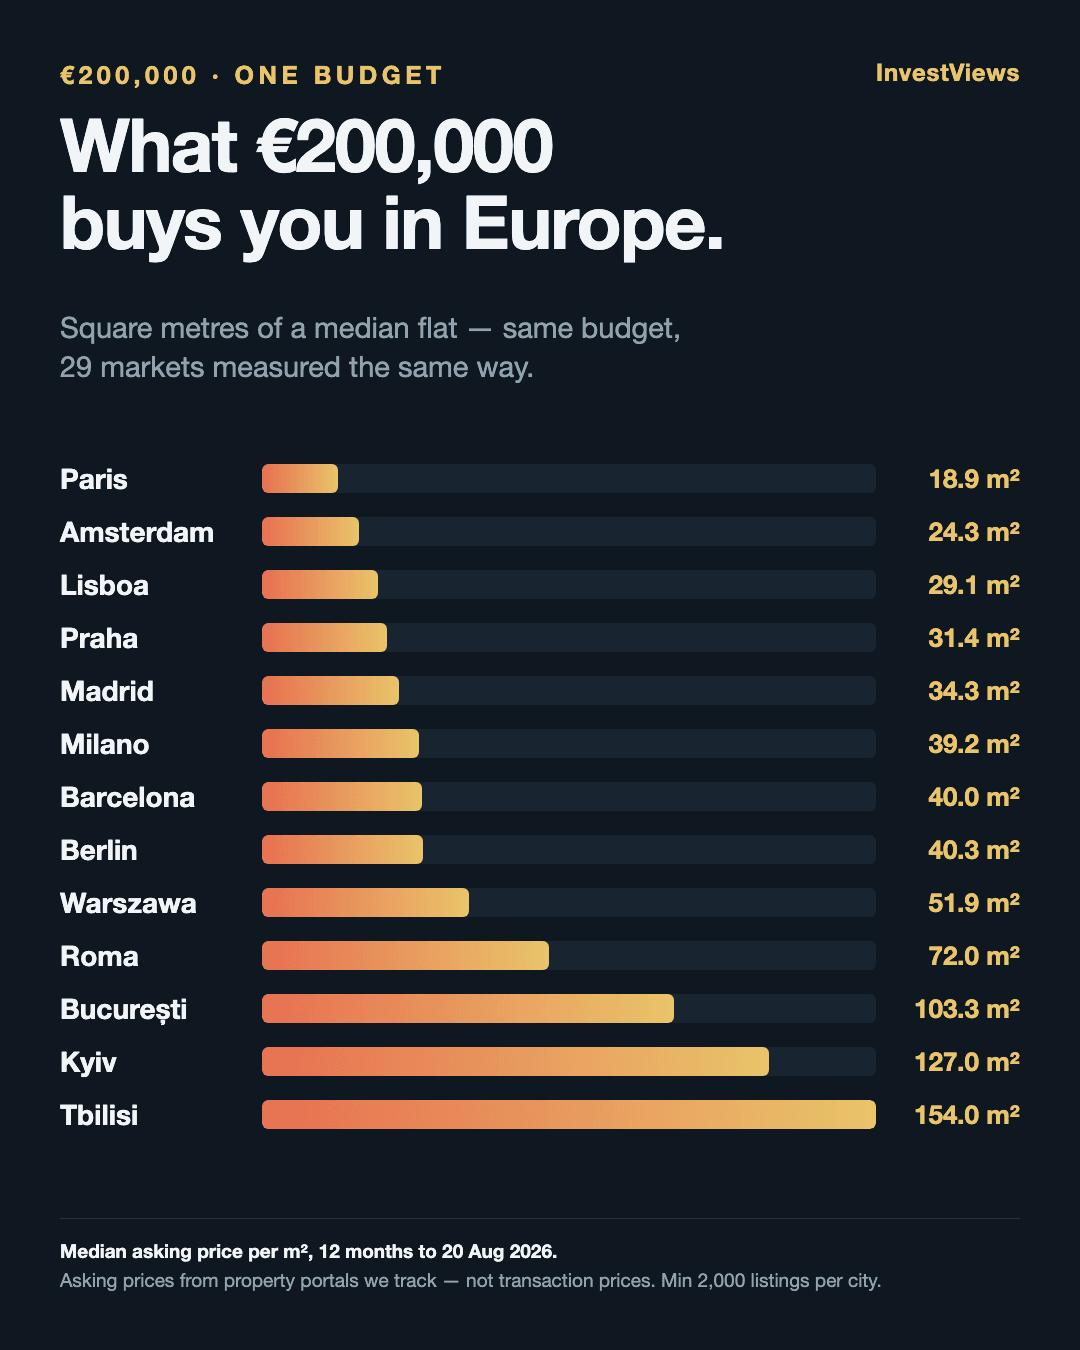
Three things the ladder shows
1. The spread is eightfold, and it is between capitals
Paris to Tbilisi is 18.9 m² against 154 m². It is tempting to dismiss that as comparing unlike places, but the same pattern holds among cities people genuinely weigh against each other: Madrid gives you 34 m², Warsaw 52 m², Bucharest 103 m². Those are all EU capitals or major markets, all measured the same way, in the same window.
2. The spread inside one country can beat the spread between countries
Rome costs €2,778/m². Milan costs €5,096/m². Rome is less than half of Milan, and the gap between them is wider than the gap between several pairs of countries in this table. A national average for Italy describes neither city.
3. "West expensive, east cheap" does not survive measurement
Prague is more expensive per square metre than Madrid — €6,376 against €5,827. Vienna sits close to Madrid. The mental map most buyers carry is a decade out of date, and it is the kind of assumption that only breaks when every market is put on one axis.
How this compares to other published figures
Comparisons like this do exist. Deloitte's Property Index covers around 75 European cities once a year, and there are others. Where our figures differ from theirs, the reason is usually methodological rather than a disagreement about the market. Deloitte put Paris at €14,900/m² in 2023; we read €10,576/m². Both can be right:
| Deloitte Property Index | This table | |
|---|---|---|
| Basis | Transaction prices | Asking prices |
| Statistic | Average (mean) | Median |
| Mix | Includes new-build, which carries a premium | Whole listing pool |
| Period | Annual report | Rolling 12 months, recomputed continuously |
It is also worth knowing what Eurostat's House Price Index does and does not do. It measures price change from a base date (2015 = 100). It is not designed to compare absolute price levels between countries, which is precisely the comparison most buyers want to make.
Method
- One record per listing. Our source data appends a row every time a listing is re-parsed, so a flat that stayed online for eight months can appear hundreds of times. Every listing is collapsed to a single record, taking its latest values, before anything is averaged. Without this step, long-lived listings — which skew towards the overpriced — would dominate.
- Twelve-month window to 20 August 2026. A short window over-weights whichever sources were most active recently and can exclude entire countries.
- One currency date. Every price is converted at the same window-edge rate, so no city gains or loses from an exchange-rate movement inside the window.
- Median, not mean — property price distributions have long right tails.
- Floors. Minimum 2,000 sale listings per city, applied to listings that carry both a price per m² and real coordinates. That usable share varies a lot by market, so applying the floor to the raw count instead would quietly let thin markets through.
- Sources. The last column is how many independent portals contribute. Where it reads 1, the figure describes that portal's listings — which in several of these markets is most of the market, but it is not the same claim.
What we left out
Cities below the 2,000-listing floor are not shown rather than shown with a caveat. Listings without a usable price per square metre or without coordinates are excluded throughout. One country in our data quotes rent annually rather than monthly, which does not affect this table but does affect our yield work, so it is excluded there. We would rather publish a shorter table we can defend.